

Broadcast sends traces only. It doesn’t send logs or metrics.
Step 1: Get your Elastic endpoint and API key
OpenRouter sends traces to the Elastic Cloud Managed OTLP endpoint, which is available on Elastic Cloud Serverless and Elastic Cloud Hosted. The endpoint looks likehttps://<project-id>.ingest.<region>.<provider>.elastic.cloud:443 and uses an Elastic API key. APM Server and Integrations Server aren’t supported, because they don’t accept OTLP/HTTP JSON.
Find your OTLP endpoint
- In Kibana, go to Add data > Application > OpenTelemetry.
- Copy the OTLP endpoint URL that Elastic shows for your deployment or project.
Create an API key
- In Kibana, go to Stack Management > API keys, or create the key from the OpenTelemetry onboarding page.
- Create an API key that can write trace data.
- Copy the encoded API key.
Step 2: Enable Broadcast in OpenRouter
Go to Settings > Observability and toggle Enable Broadcast.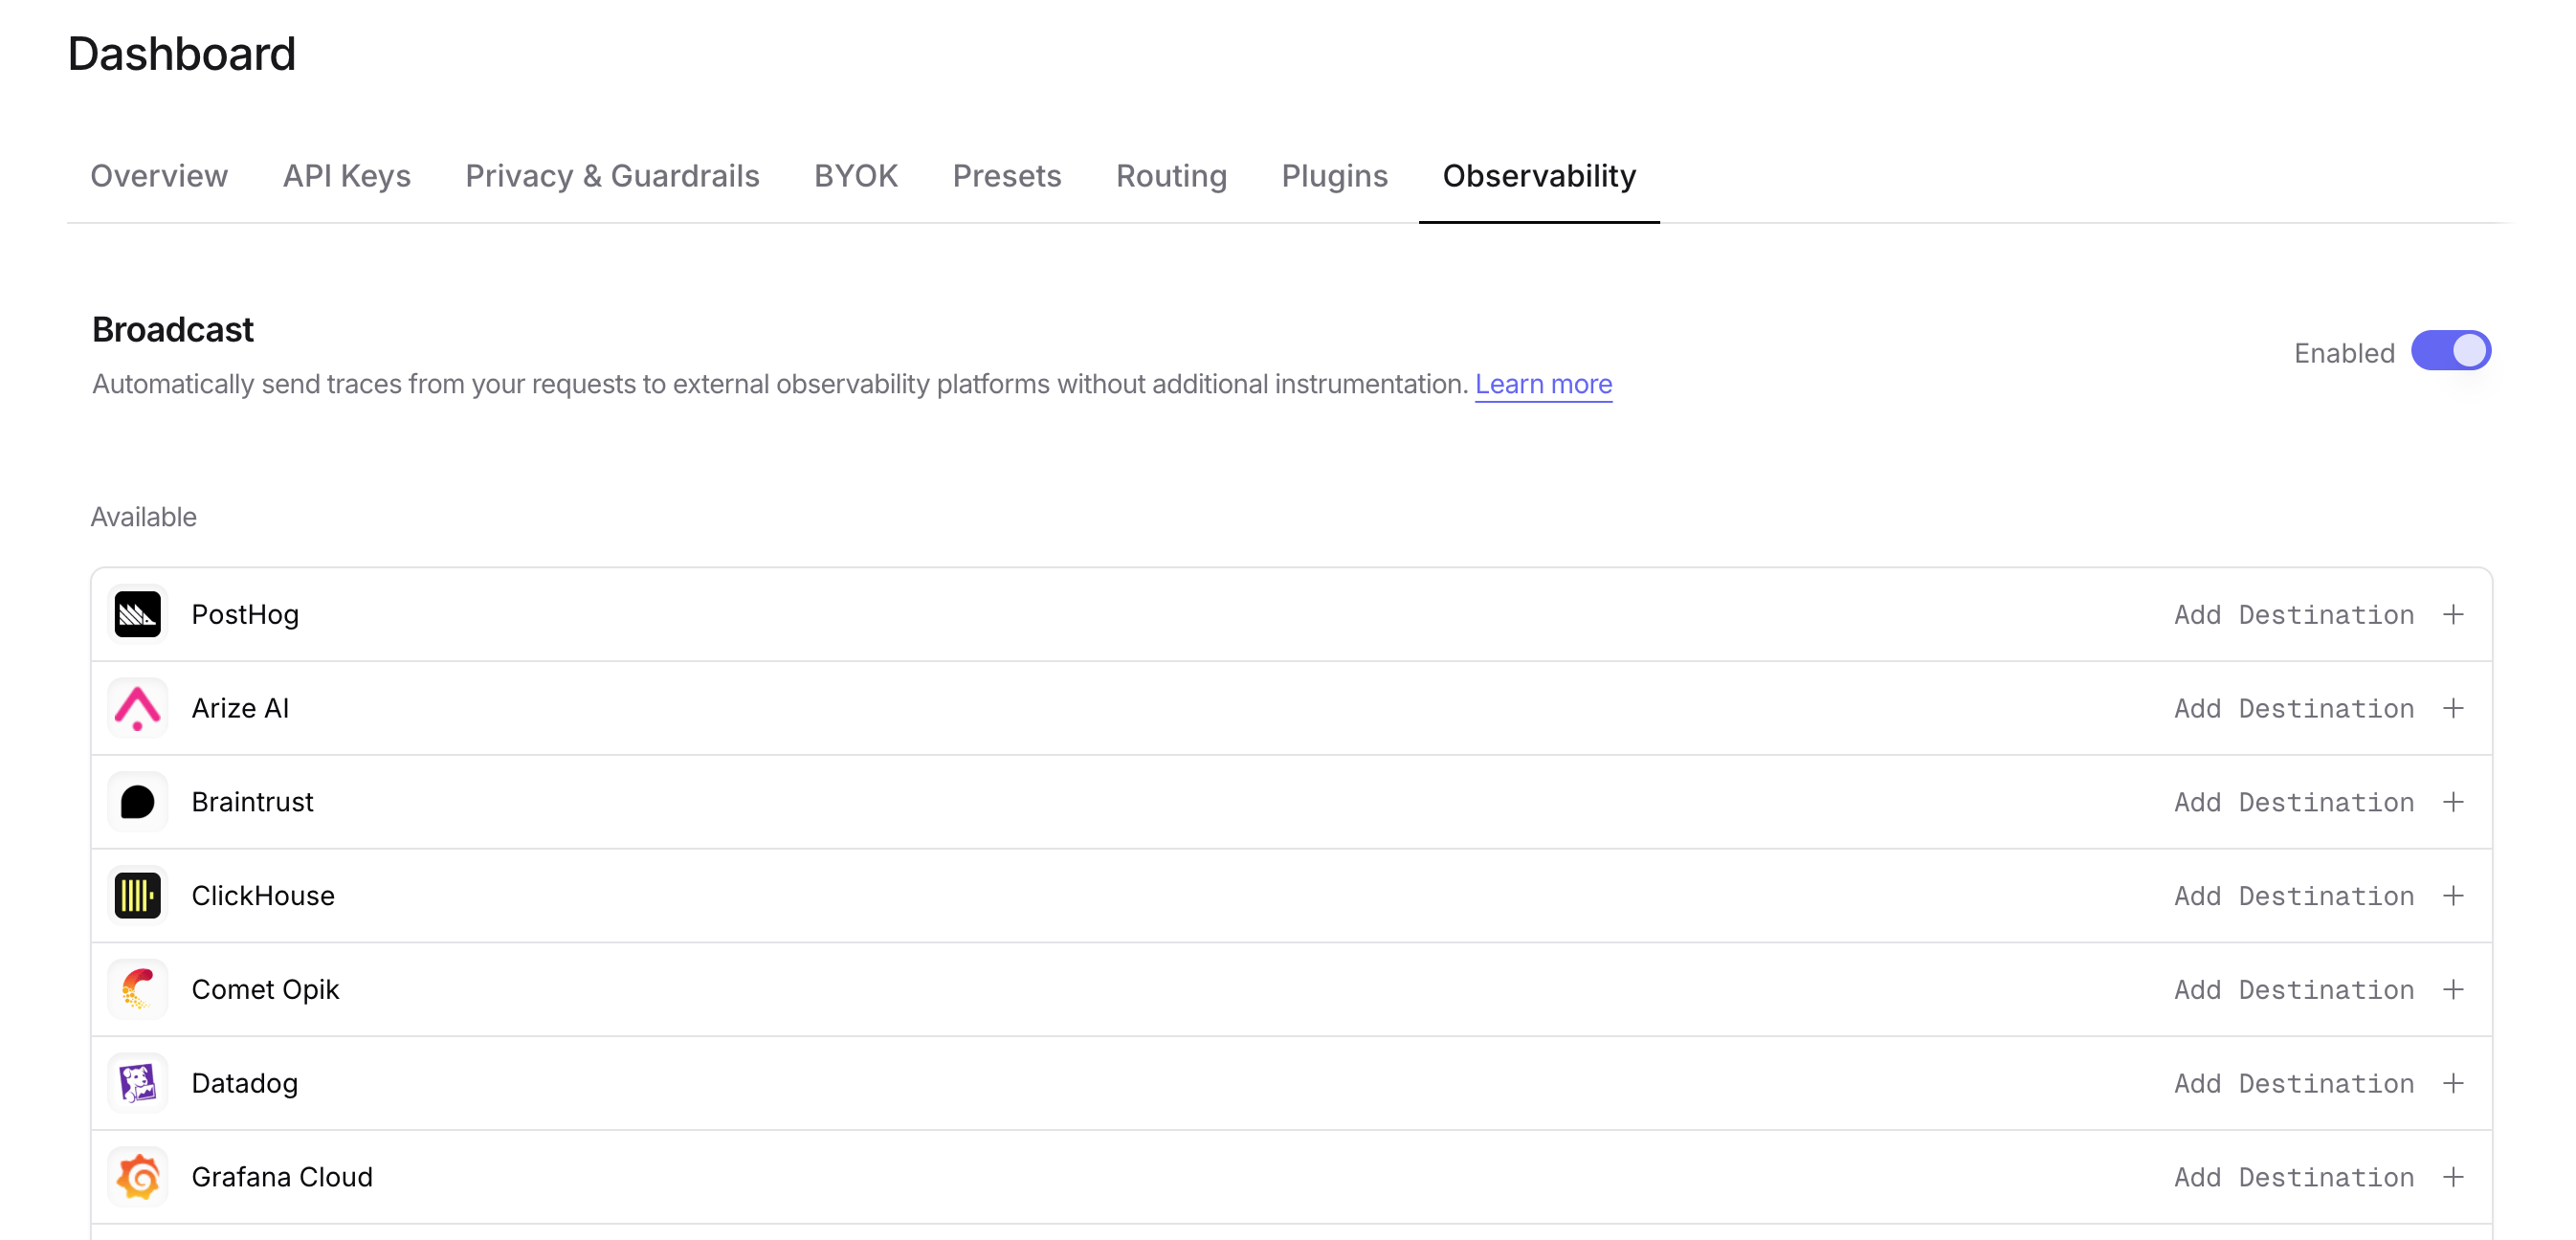
Step 3: Configure Elastic Observability
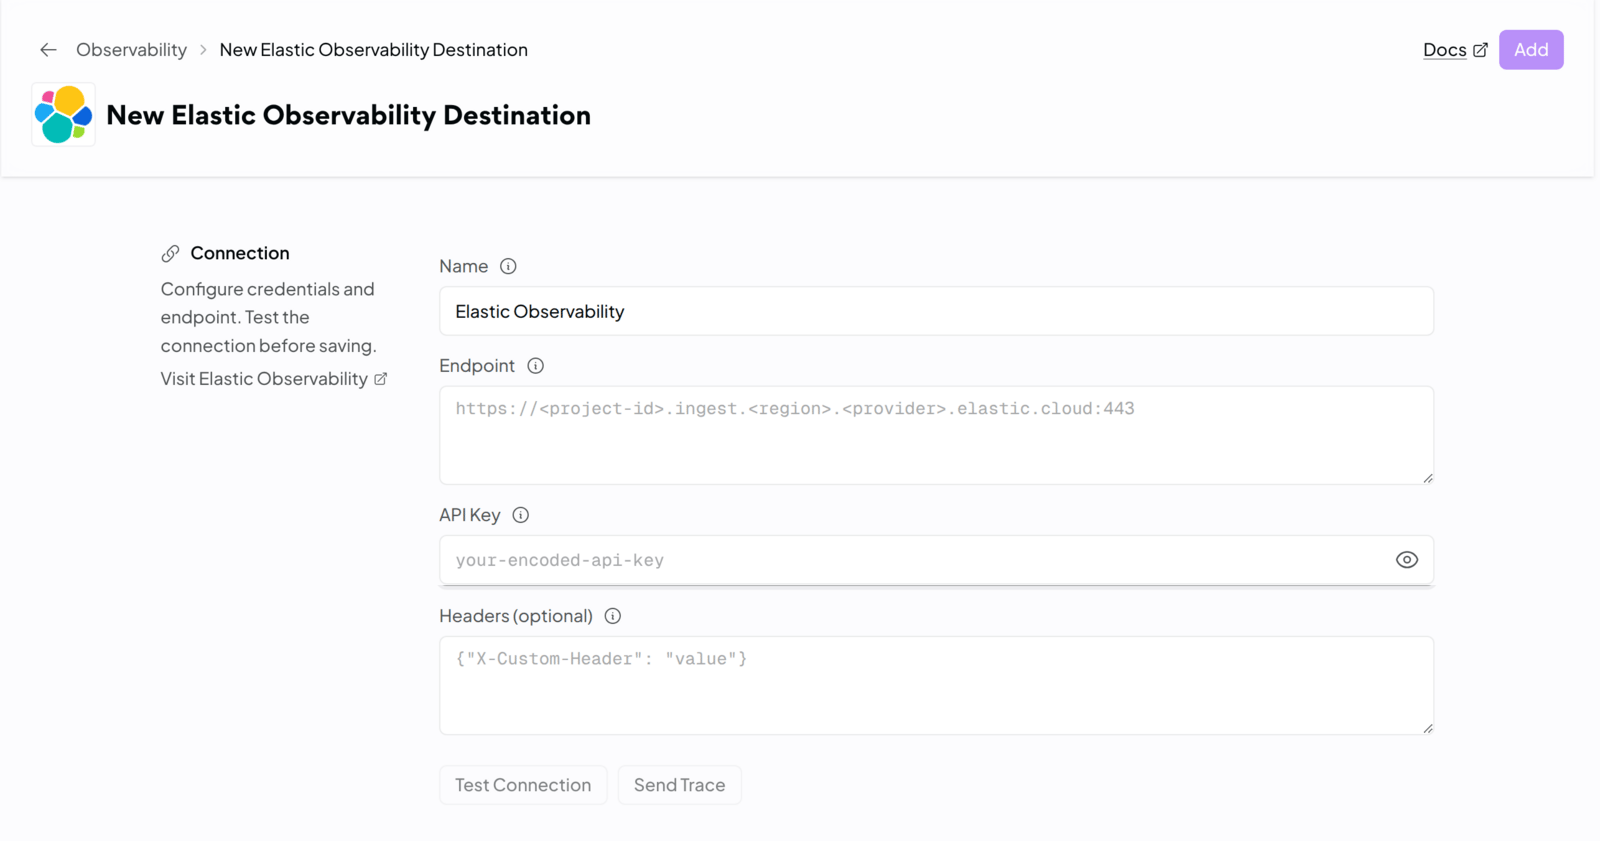
Click the edit icon next to Elastic Observability and enter:- Endpoint: Your Elastic OTLP endpoint. OpenRouter appends
/v1/tracesfor you, so enter the base URL. An endpoint that already ends in/v1or/v1/tracesalso works. - API Key: Your encoded Elastic API key. OpenRouter sends it as
Authorization: ApiKey <key>. - Headers (optional): Extra HTTP headers as JSON, for example
{"X-Custom-Header": "value"}. Custom headers can’t overrideAuthorizationorContent-Type.
Step 4: Test and save
Click Test Connection to verify the setup. The configuration only saves if the test passes. A401 means Elastic rejected the API key.
Step 5: Send a test trace
Make an API request through OpenRouter, then find the trace in Elastic.Viewing your traces
Elastic stores OpenRouter spans in thetraces-generic.otel-default data stream with the service name openrouter.
- Applications: In Kibana, open Observability > Applications > Service inventory and select the
openrouterservice. - Discover: Open Discover, pick a data view that covers
traces-*, and search for a generation ID. For example:
Trace attributes
OpenRouter traces include the following key attributes. Elastic spans use the current OpenTelemetry GenAI attribute names.Resource attributes
service.name: Alwaysopenrouter
Span attributes
openrouter.trace.id: The OpenRouter trace IDgen_ai.operation.name: The operation type (for example,chat)gen_ai.provider.name: The provider that served the requestgen_ai.request.model: The requested modelgen_ai.response.model: The model that served the requestgen_ai.response.id: The OpenRouter generation IDgen_ai.response.finish_reasons: Why the generation ended, as a string array (for example,["stop"])gen_ai.usage.input_tokens: Number of input tokensgen_ai.usage.output_tokens: Number of output tokensgen_ai.usage.cache_read.input_tokens: Input tokens served from the provider’s prompt cachegen_ai.usage.audio.input_tokens: Audio input tokens, when the provider reports themgen_ai.usage.reasoning.output_tokens: Reasoning output tokens, when the provider reports themgen_ai.input.messages: The request messages as a JSON string, in the OpenTelemetryroleandpartsformatgen_ai.output.messages: The model’s response as a JSON string, with reasoning, text, and tool call partsgen_ai.tool.definitions: The tools offered to the model, as a JSON string
Custom Metadata
Custom metadata from thetrace field is sent as span attributes under the trace.metadata.* namespace, so you can filter on it in Discover.
Supported Metadata Keys
Example
Additional Context
- The
userfield maps touser.idin span attributes. - The
session_idfield maps tosession.idin span attributes.
Troubleshooting
Test Connection fails with 401
Elastic rejected the credentials. Check that the API key is the encoded value and that it can write trace data.Traces don’t appear
- Check the time range: Widen the Kibana time picker to include the request time.
- Check the endpoint: Use the OTLP endpoint from the OpenTelemetry onboarding page, not your Kibana or Elasticsearch URL.